CloudWatch ❀️ OpenTelemetry in Application Insights | DynamoDB Day 19th of November


AWS FOR THE REAL WORLD
⏱️
Reading time: 20 minutes
🎯
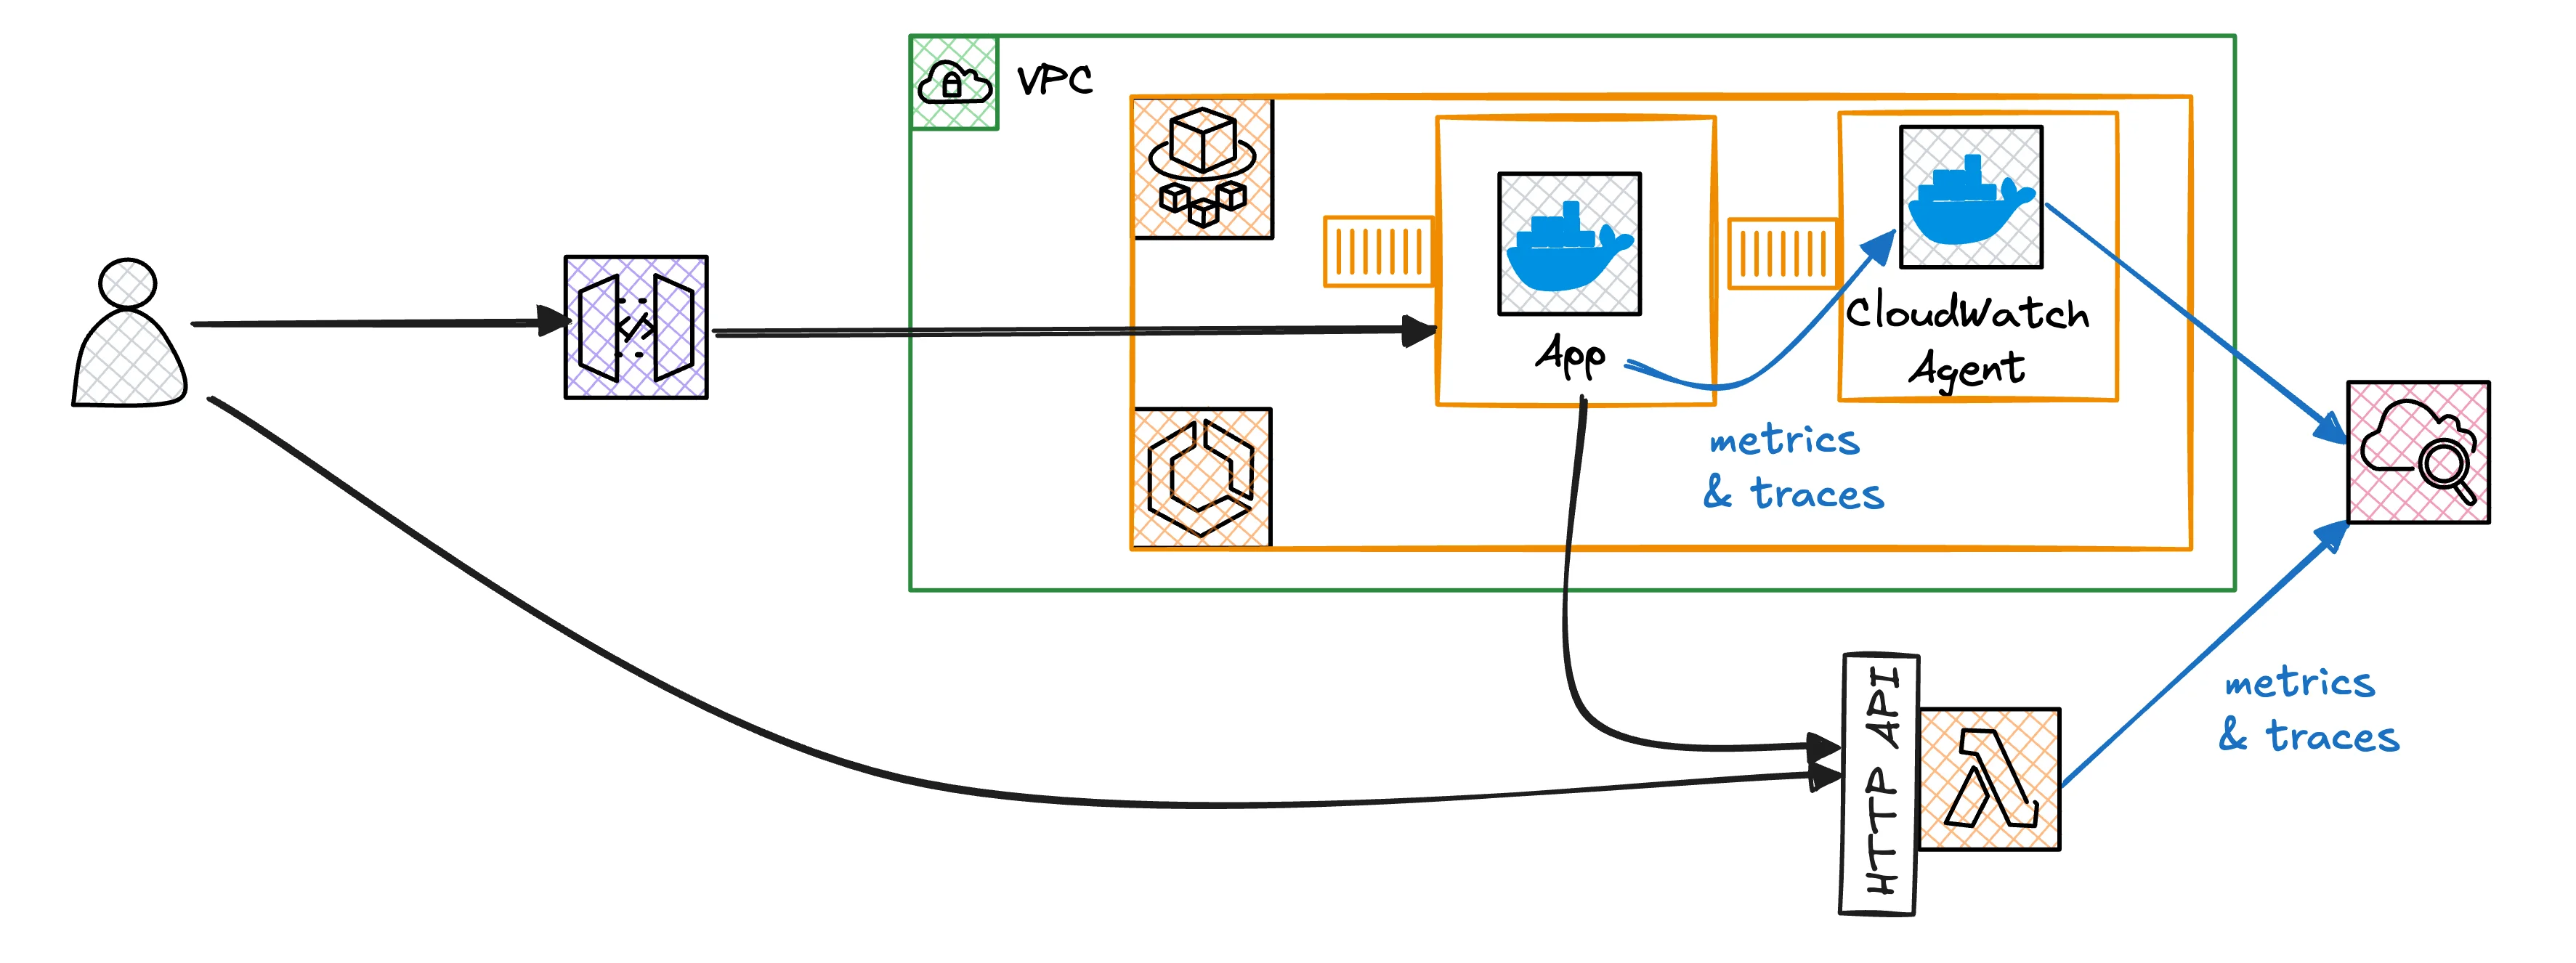
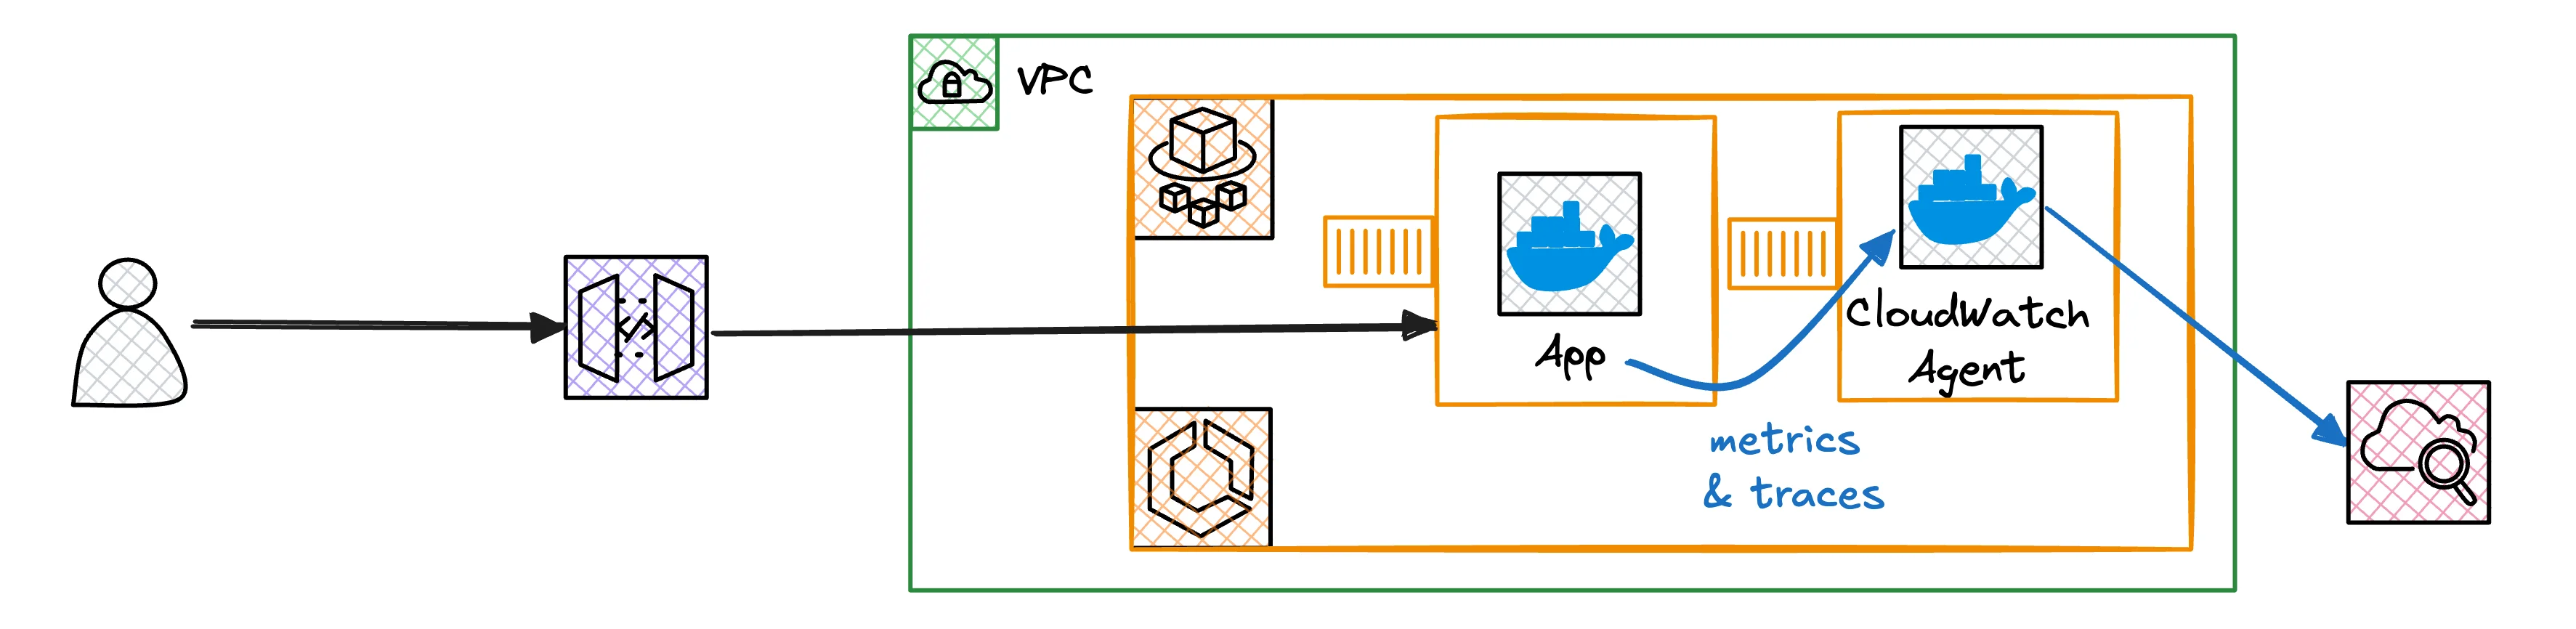
Main Learning: How to achieve end-to-end observability by integrating CloudWatch Application Signals with OpenTelemetry for automatic service discovery and cross-service request tracing in AWS.
πŸ“

​

Hey Reader πŸ‘‹πŸ½

​
Welcome to this week’s
AWS Fundamentals Newsletter.

​
Pre:Invent season is starting slowly with new launches like:

​
We are stoked to see what else will be launched in re:Invent.

Personally, I suspect that many of the basic, bread-and-butter services will be getting more β€œhardened out.”

​

Payload limits are already a great sign. And the second thing I see coming is, of course, a lot of AI features and services.

Let’s see!

​

But let’s first hear about this week’s sponsor! πŸ‘€

πŸ“Š
DynamoDB Day Event Partner
DynamoDB Day Event

Join the Free DynamoDB Day Virtual Event

Learn real-world lessons from AWS and DynamoDB experts. Get practical knowledge on data modeling strategies, scaling approaches, recovery procedures, and resilience best practicesβ€”all from industry leaders like Alex DeBrie.

Free
Virtual event
Nov 19
2025
Featured Talks & Topics:
πŸ’Έ Cost-Effective Data Models - Build performant & cost-optimized DynamoDB schemas
πŸ‘Ύ Ubisoft Case Study - How they handle millions of concurrent users with DynamoDB
πŸ—ƒοΈ SQL to NoSQL Migration - Practical strategies for transitioning from relational databases
🎯 Data Modeling Deep Dive - Master DynamoDB schema design with Alex DeBrie

Featuring Alex DeBrie and AWS experts on November 19, 2025

Event partner supporting DynamoDB & NoSQL education

​

In this week's deep dive we talk about CloudWatch, OpenTelemetry, and their newish feature Application Signals. As always, we have a full GitHub Repo so that you can play around with the code as well!

​

πŸ“š This Week's Deep Dive

Your AWS application works most of the time. Lambda functions handle requests. ECS containers run your services. Then a user complains about slow response times or errors.

You check CloudWatch logs and see scattered error messages across different services. You know something broke, but figuring out where the request failed means jumping between Lambda logs, ECS container logs, and API Gateway metrics. You're debugging with incomplete information.

What you'll build

By the end of this tutorial, you'll have:

  • Automatic service discovery that maps your application topology in real-time
  • Request tracing through ECS containers to Lambda functions
  • Custom business logic spans for detailed application code visibility
  • Real-time service maps in CloudWatch Application Signals
  • Transaction Search to follow individual requests across your stack
Final Architecture

No more jumping between different log streams to debug issues.

We'll solve this with Application Signals and OpenTelemetry. Application Signals maps your services and tracks key metrics. OpenTelemetry instruments your code to trace requests across all services. You can see the exact path a request took through your system. Similar to X-Ray but infrastructure-agnostic.

This article shows how to build observability for applications using Fargate containers and Lambda functions. You'll instrument everything to trace requests across your stack. Service maps show how your services communicate.

All the code and infrastructure configurations are available in our example repository. The project uses SST v3 to deploy everything, making it easy to follow along and experiment with different configurations in your own AWS account.

awsfundamentals-hqawsfundamentals-hq / cloudwatch-application-signals-otel
πŸ”’ A project demonstrating cloudwatch application signals otel
awscloud

View on GitHub β†’

What is CloudWatch Application Signals?

CloudWatch Application Signals is AWS's automatic application monitoring service. It watches your applications running on EC2, ECS, and Lambda without custom monitoring code.

The service tracks five key metrics: call volume, availability, latency, faults, and errors. Application Signals also builds a visual map called Application Map of your services automatically.

Why it matters

Before Application Signals, observability required custom dashboards, metric collection code, and manual service correlation. Application Signals automates this.

You can set up Service Level Objectives (SLOs) to track application performance. To ensure your API responds within 500ms for 99% of requests, create an SLO and Application Signals monitors it.

What is OpenTelemetry

OpenTelemetry (OTEL) is an open-source observability framework that instruments your application code to collect traces, metrics, and logs. It tracks request flow through your system.

When a user makes a request to your API, OpenTelemetry creates a trace that follows that request through every service. It records timing, data flow between services, and error locations. This creates a complete timeline for each request.

Combining Application Signals with OpenTelemetry

AWS services generate metrics automatically, but they don't show what happens inside your application code. OpenTelemetry fills this gap by tracking custom business logic, database queries, and external API calls.

Combining OpenTelemetry with CloudWatch Application Signals provides AWS service metrics and detailed application traces in one place. You can see that your Lambda function is slow, then drill down to find the specific database query causing the issue.

Setting Up OpenTelemetry on ECS with Fargate

Setting up OpenTelemetry on ECS requires:

  1. A simple application deployed to Fargate
  2. The OpenTelemetry API dependency
  3. Instrumentation of the backend application with the OTEL library
  4. The CloudWatch agent that receives OTEL traces and forwards them to CloudWatch
Simple Architecture

OpenTelemetry on ECS Fargate uses two containers. The CloudWatch Agent container collects telemetry data. Your application container includes OpenTelemetry instrumentation.

The tutorial covers complete setup including IAM roles, ECS infrastructure, environment variables, and verification steps. You'll also learn how to set up OpenTelemetry on Lambda using the ADOT layer, create custom spans for detailed tracing, and explore your traces in CloudWatch Transaction Search.

πŸš€ Read the Full Tutorial β†’

Summary

This was this weeks newsletter πŸ’Œ

​

Do you have anything to share with us? What are your main AWS or Observability challenges right now? Are you heading to re:invent? πŸ‘€

​

Have a great week ahead!
- Sandro & Tobi ✌🏽

AWS for the Real World

We teach AWS for the real world - not for certifications. Join more than 10,500 developers learning how to build real-world applications on AWS.

Read more from AWS for the Real World

AWS FOR THE REAL WORLD ⏱️ Reading time: 10 minutes 🎯 Main Learning: Building and testing Lambda@Edge functions with CloudFront is complicated, as deployments can take up to 10 minutes. With LocalStack, you can build, test, and debug your Lambda@Edge functions locally! πŸ“ Blog Post πŸ’» GitHub Repository 🎬 Watch on YouTube Hey Reader πŸ‘‹πŸ½ Happy new year! We hope you had a great time with your families and loved ones 😊 We took some time off. Sandro is bridging the cold winter in Thailand (say hi if...

AWS FOR THE REAL WORLD ⏱️ Reading time: 7 minutes 🎯 Main Learning: Learn how to securely connect to your RDS database in a private subnet using an EC2 jumphost and AWS Session Manager. No SSH keys needed. πŸ“ Blog Post πŸ’» GitHub Repository 🎬 Watch on YouTube Hey Reader πŸ‘‹πŸ½ Hope you had a great Christmas with your loved ones πŸŽ„ Tobi and I spent a few days in Berlin consulting with a startup, then caught the last sunny days in Munich before winter really hits. This week: how to actually connect to...

AWS FOR THE REAL WORLD ⏱️ Reading time: 6 minutes 🎯 Main Learning: Build a central alerting approach with CloudWatch, Lambda, EventBridge, and CDK across your AWS Organization. πŸ“ Blog Post πŸ’» GitHub Repository 🎬 Watch on YouTube Hey Reader πŸ‘‹πŸ½ Welcome to the first issue after re:Invent. For everybody who was out there, I hope you came home safe & healthy. I heard re:Invent cold is a thing like Oktoberfest cold in Munich 🍻 πŸ“° This Week in AWS ⏸️AWS Lambda Durable Functions Lambda launched Durable...