We teach AWS for the real world - not for certifications. Join more than 10,500 developers learning how to build real-world applications on AWS.
🚀 Dive into AWS CloudWatch & 📖 Upgrade Alert: New Fundamentals Book Version!
👀 This is not properly displayed? Here is the online version! 💡
Hi Reader 👋🏽
new week, new AWS newsletter. This week with exciting news 💖
TL;DR of This Issue
- We launch a free update of AWS for the Real World Soon. Check out our scheduled Product Hunt Launch.
- Let's talk about CloudWatch 📝
Book Update
First, let's talk about our book update! AWS for the Real World will get a massive free update. What will be included in the update?
- Typos &Grammar - we heard you and we fixed them.
- Diagrams & Images - all diagrams and images were updated to follow the same consistent style.
- Missing Sections - we missed a few important parts in several chapters. They are added now. For example, S3 Multi-Region, SQS Partial Failures, or DynamoDB Single Table Design.
Why a Free Update?
We have created a lot of content (> 100 posts) before creating the book. However, a book is still on another level. We want to provide you with a good quality and we want that you enjoy learning about AWS.
We knew from the beginning that it couldn't be perfect from day one. This is why we've collected feedback from all readers and incorporated it.
The best part. The update is free for everybody who purchased the book.
The second best part: We will launch the updated book on Product Hunt together with a discount of 25%.
We are not there yet, but we will be soon! If you want to support us (additionally to being an awesome part of the community) we would highly appreciate it if you could sign up at Product Hunt and give us feedback on their platform, once we launch.
We plan to launch the book on 8th September on Product Hunt.
That's it about internal updates, let's continue with this week's service, 🥁 CloudWatch
CloudWatch - Make Logging great again
CloudWatch is, similar to IAM, one of the most underrated services. Every AWS developer, admin, or support associate needs to use this service. But so many people tend to jump right towards third-party tools like Datadog, Lumigo, or New Relic before even trying to understand CloudWatch.
We want to change that by educating more people on this amazing service.
Introduction
What is CloudWatch? CloudWatch is a suite of quite a few different products. All of these products aim to make Observability and Monitoring better within one or more AWS Accounts. The main functionalities of CloudWatch are Logs and Metrics. This is what we will focus on in this broadcast since these are the most used tools.
Logs
One of the main products within CloudWatch is CloudWatch Logs. CloudWatch Logs is the centralized logging space within AWS. Every AWS Service natively logs to CloudWatch Logs.
Logs are the text output of your application. For example, if you put a print statement (console.log for Node.js) into your Lambda function and run it. You will find the log in CloudWatch. In production applications you normally log with a structured logger, check out the Logger from AWS Lambda Powertools for example.
A log can look like the following JSON object:
CloudWatch Log Concepts
CloudWatch has the concept of:
- Log Event - the log itself
- Log Stream - a stream of multiple log events
- Log Group - a container of multiple streams
Log Event - The Log Output
The Log Event is the actual log output from your application. For a Lambda function that means one invocation of your Lambda function logs a Log Event.
Each Log Event contains the following information:
- Timestamp: The time of your log
- START: An identifier when your log event starts
- END: An identifier once your log event ends
- RequestId: A unique request ID to this one log event
Log Streams - One or more Log Events
A Log Stream can hold multiple Log Events.
If we continue on our Lambda example, one Log Stream would be all Logs of one running Lambda container. For example, if your Lambda container runs for 15 minutes and receives 10 requests within the same container. All of these logs will be present in the same Log Stream.
Log Groups - All Log Streams of one Application
Log Groups is the highest order of the Logs concept. One Log Group is dedicated to one application of service.
For a Lambda function named thumbnail, the dedicated Log Group would be: /aws/lambda/thumbnail
Log Insights
As we know a cloud architecture consists of several services. Finding the logs of one user session can be quite overwhelming. This is where CloudWatch Log Insights helps you.
With Log Insights you can query your different log groups with a query language, similar to SQL.
👆🏽 Important Note: To be able to query logs efficiently you need to use a structured logger (JSON logger).
Metrics & Alarms
CloudWatch Metrics is the second main functionality of CloudWatch. A lot of AWS services automatically send metrics to CloudWatch.
Example metrics are:
- RDS connections
- AppSync 400 errors
- API Gateway Latencies
- Lambda Throttles
You can use these metrics to further understand how your application behaves. You can also apply statistical functions like sum, average, mean, or many others on them.
Metrics build the basis for creating Alarms. Alarms notify you in case something behaves abnormally in your metrics.
Typical alarms are:
- Number of errors in your Lambda function
- Increased number of 4xx or 5xx errors
- Visible messages in your DLQ
Alarms call an SNS (Simple Notification Service) topic. This gives you a huge flexibility.
You can get notified via E-Mail or In-App. You can also attach a Lambda function to your topic and do whatever you want, like sending a message to Slack or Discord.
Pricing
Pricing is a really important topic in CloudWatch. In fully-serverless applications, CloudWatch is often the number one cost driver. And the worst part: Only a few people estimate CloudWatch costs right from the beginning into their estimated bill. It is crucial to understand the pricing of CloudWatch to avoid unexpectedly high bills.
Pricing Infographic
We have our own infographic for the pricing:
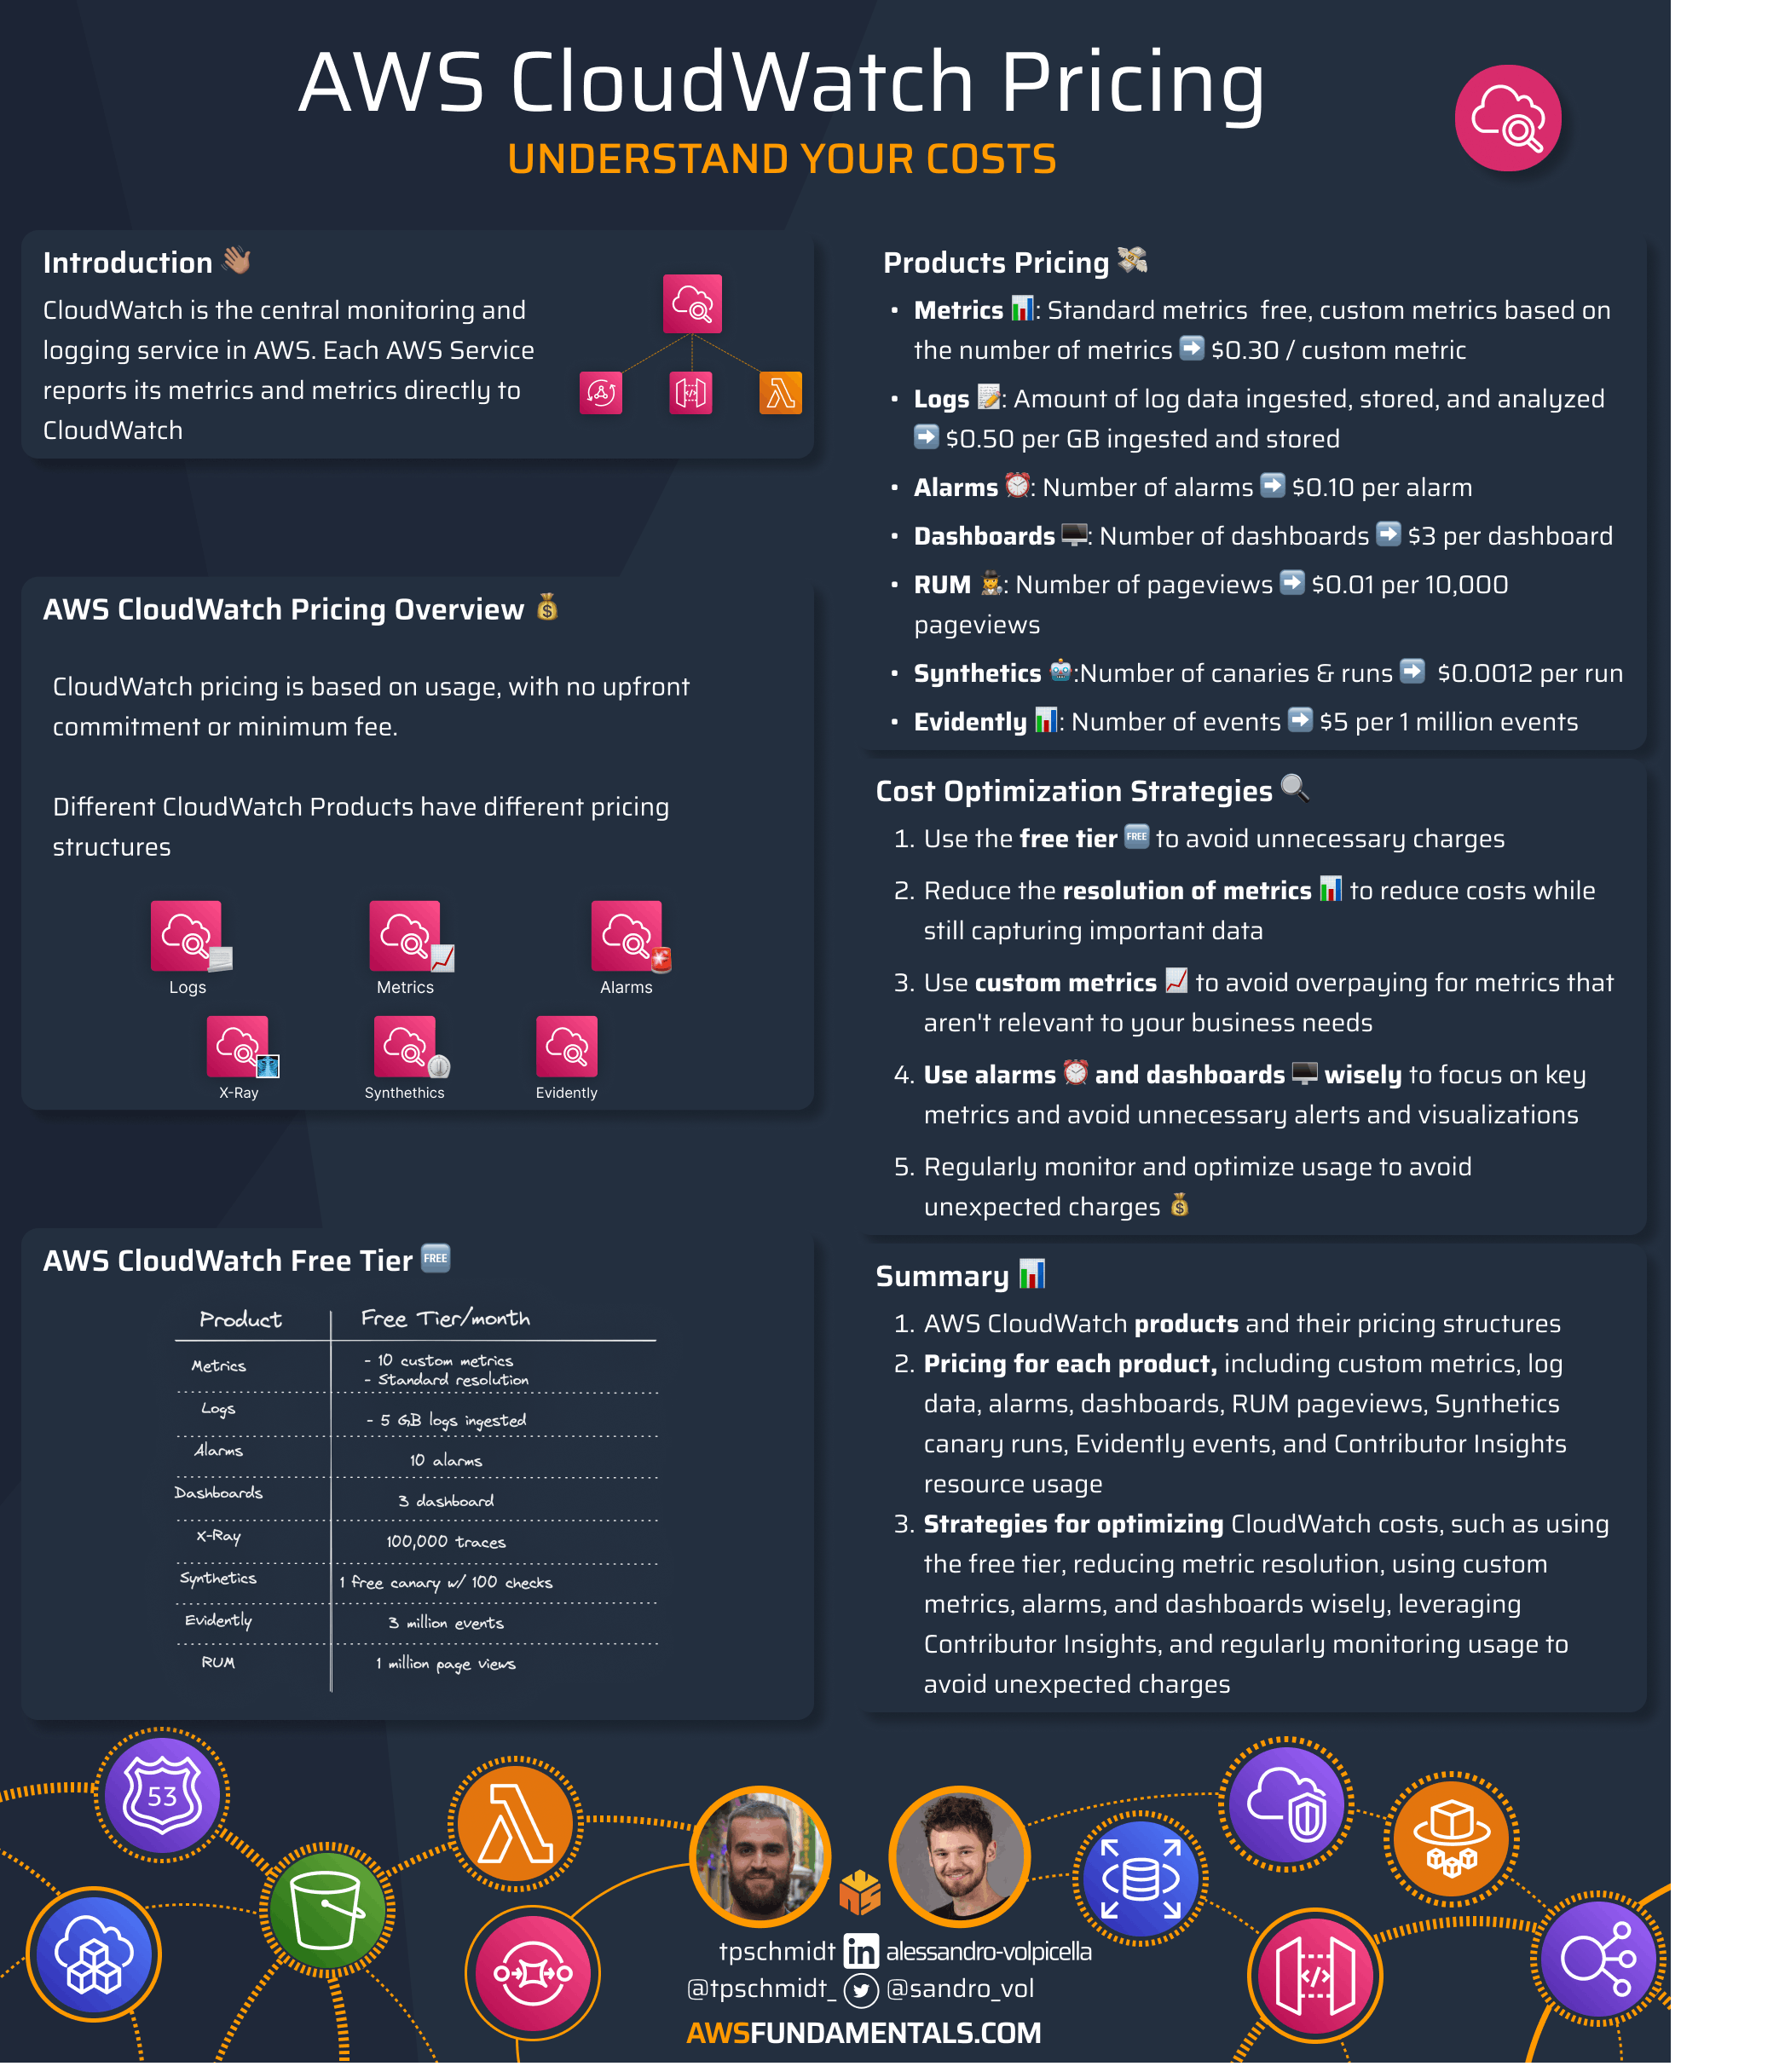 |
There are many CloudWatch products. This newsletter issue only talked about Metrics and Logs. The pricing is different for all products.
Free Tier
Let's start with the free tier.
- Logs - 5 GB of ingested, stored, and queried logs are free per month
- Metrics - 10 custom metrics (👆🏽) are free per month as well as 10 alarms
Logs - Watch Our for Ingest
Logs pricing is based on the ingest of logs (how much are you logging) and the retention (how long and how much do you store).
Ingestion
CloudWatch charges for the number of log data ingested into CloudWatch. This is calculated per account and per region. The price depends on the region, for example in US-East-1 it costs $0.50 per GB log data. This can get quite expensive!
Storage
The second price point is the storage of logs. It costs $0.03 per GB of stored logs. This is less expensive than ingestion. It is still recommended to set a retention period as low as you can to constantly remove unused log messages.
Metrics - Custom Metrics Are Expensive
Standard Metrics are free. These metrics will be provided from different AWS services at no cost.
Custom Metrics cost extra. The pricing is based on the number of custom metrics you create and the resolution you choose. The resolution can be between one second and one minute. One custom metric in US-east-1 costs $0.30 per metric.
Wrap Up ✌🏽
CloudWatch is an essential service to learn. Please don't jump right into a third-party tool, try to use Log Insights and X-Ray, and create some alarms. It is amazing how much you can do with it.
This is it for this newsletter. We're super stoked to improve the AWS Fundamentals book and to see our first Product Hunt Launch ever.
If you want to support us it would be amazing if you jump over to our launch and give us some feedback or follow it. We will send out a separate email once the launch starts 😊
Still hungry for AWS content? Have a look at our blog! 📚 ↓
 |
AWS for the Real World
We teach AWS for the real world - not for certifications. Join more than 10,500 developers learning how to build real-world applications on AWS.
AWS FOR THE REAL WORLD ⏱️ Reading time: 11 minutes 🎯 Main Learning: Most teams should stay serverless. EKS only pays off at real scale. 📝 Blog Post Hey Reader 👋🏽For years we told everyone the same thing: don't run Kubernetes! And we meant it. Running k8s yourself is a second full-time job. Cluster upgrades, etcd backups, some networking plugin that falls over on a Tuesday and nobody can say why.We're serverless people through and through. Lambda first, a queue behind it, scale to zero, go...
AWS FOR THE REAL WORLD ⏱️ Reading time: 12 minutes 🎯 Main Learning: Most of the complaints in the viral "leaving AWS" post are skill issues — but egress pricing is a fair hit. 📝 Blog Post Hey Reader 👋🏽Recently, a post with the title "I returned to AWS and was reminded why I left" hit 810 upvotes on Hacker News last week and went pretty viral with it.I read it twice before forming an opinion. My honest take: most of the complaints are skill issues! 🤷♂️Nevertheless, the post is well written and...
AWS FOR THE REAL WORLD ⏱️ Reading time: 10 minutes 🎯 Main Learning: Describe the agent: model, prompt, tools and AWS runs the orchestration loop behind one API call! 📝 Blog Post Hey Reader 👋🏽 If you've ever built an agent on AWS, you know the pain: glue Bedrock, Lambda, and DynamoDB together, grab LangGraph or Strands, then also own the orchestration loop, the memory layer, and your own tracing. 😅 A "simple" agent ends up with multiple layers of pain.AWS just shipped something that takes most...