Hey Reader
First and foremost, we want to extend our gratitude for your continued support and engagement with our newsletter. 🧡
One of our sincere goals is that you're finding success and growth on your journey to deepen your knowledge and grow your skills.
This issue marks our fourth update for our journey of The CloudWatch Book 📕 and dives into an equally crucial theme: Building Observability to Increase Resiliency 🕵️ 💪
In this edition, we want to update you on our progress, especially on our new table of contents.
We'll also aim to bridge the gap between the technical nuances and features of CloudWatch and the broader concept of observability. We want to guide you through real-world incident examples and how you can leverage CloudWatch efficiently.
Observability is a practice that can significantly enhance how individual developers, teams, or organizations interact with their applications and data.
With our book, we not only want to educate you on CloudWatch and observability, but we also want to guide you on how observability can become a culture at your project, startup, or company.
We dearly missed this in previous companies and projects.
So let's dive into this.
New Table of Contents
We've thought intensively about our table of contents and adjusted many parts.
Mainly the introduction and closing chapters were changed. Now we also include the subchapters:
-
Preface - Overview of the book’s purpose and contents.
- Introduction to the Book
- Who This Book Is For
- Who This Book Is Not For
- What You'll Learn in This Book
-
Understanding Observability - Introduction to observability and CloudWatch’s role.
- The Evolution of Observability
- The Pillars of Observability: Metrics, Logs and Traces
- What Observability Matters
-
The Role of CloudWatch in Observability
- Tailored for AWS Professionals And Ambitious Learners
- Amazon CloudWatch As Your Key to Mastering Cloud Operations
- Why CloudWatch Can Be Your Single Go-To Observability Solution
- Navigation This Book: How to Get the Most Out of Your CloudWatch Journey
- A Real-World Application: Getting your Hands-On Experience with CloudWatch
- Basics of CloudWatch - Fundamental concepts aligned with the Observability Talk - more on this in the next part of the newsletter ✌️
- Example Project - Practical application involving AWS services.
- Logs & Insights - How to work with and gain insights from logs.
- Metrics - Overview of standard and custom metrics including EMF.
- Alarms - Setting up alarms for AWS services and specific conditions.
- Dashboards - Creating dashboards to visualize service metrics.
- X-Ray - Utilizing X-Ray for service lens and distributed tracing.
- Synthetics - Setting up synthetic flows for application testing.
- RUM - Monitoring real-time user interactions.
- Evidently - Implementing A/B testing and feature flags.
- Anomaly Detection - Understanding and setting up anomaly detection.
- Integration - Integrating CloudWatch with other services and tools.
-
Security and Compliance - Ensuring security and compliance through monitoring.
- Monitoring for Security and Compliance
- Log Retention and Encryption
- Auditing and Reporting with CloudWatch
- Case Studies - Insights from real-world applications reviewed by their engineers.
-
CloudWatch for Enterprises - Scaling and optimizing CloudWatch for large organizations.
- Architecting for Scale with CloudWatch
- Integration of CloudWatch Across Multiple AWS Accounts and Regions
- Advanced Security and Compliance Strategies
- Cost Management and Optimization
- Building a Company-Wide Culture of Observabilit
-
CloudWatch Limitations - Discussing limitations and when to use third-party tools.
- Data Retention and Access
- Custom Metrics and Events Granularity
- Alerting Capabilities and Integrations
- Cost Management for Large-Scale Deployments
- When Third-Party Tools Become A Necessity
- Conclusion - Summarizing key points and closing remarks.
- Appendices - Additional resources and information.
Questions to you:
- How do you like the adjustments?
- What do you think of it in general?
- Are you missing anything?
Please let us know! You can send us an email (just hit the reply button), write us on Twitter or LinkedIn, or join our Discord 👾! ✌️
We'll read and respond to every single message! 😊
Building Observability to Increase Resiliency: A Quick Dive
Observability isn't just a buzzword; it's an operational mode for modern systems. And a cultural approach that needs to be cultivated across developers.
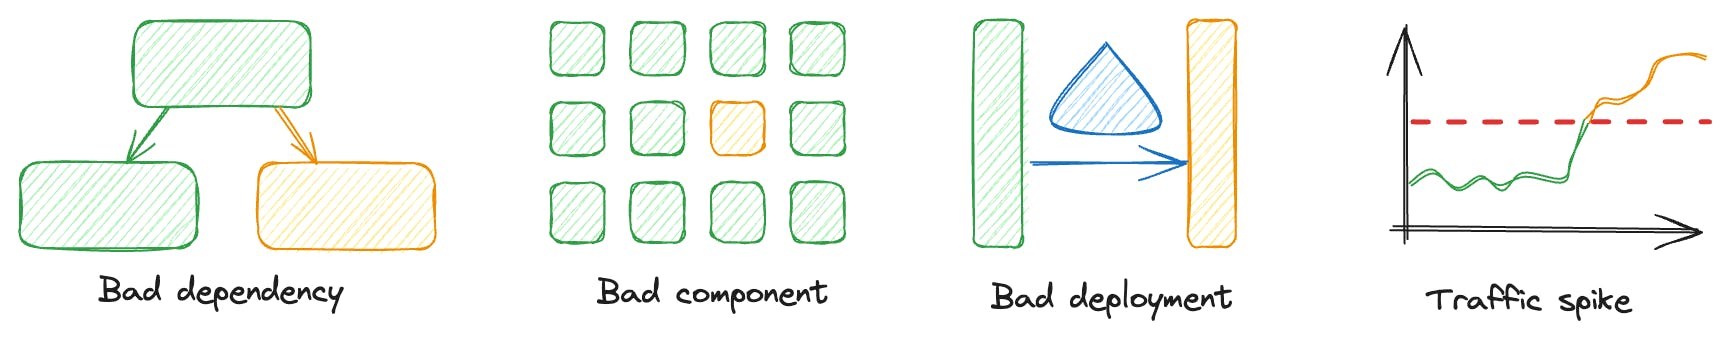
Using tools like CloudWatch, teams can monitor, alarm, and trace their operations to quickly diagnose and resolve issues 🐛. From bad dependencies and components to deployment issues and traffic spikes, understanding each facet of your system is crucial.
Imagine this: your website is having trouble and the overall error rate spikes.
Without observability, you're in the dark. With it, you can trace the problem across your entire server or to a specific page, using different types of alarms, and also uncover hidden issues 🔎.
And when a new deployment tanks your system's health, automated rollbacks are your first responder, minimizing downtime.
But observability isn't just for when things go wrong. It's about preventing future fires 🔒. By closely monitoring everything from CPU usage to thread pools, and employing auto-scaling, you ensure your system is not just reacting but proactively adapting to demands.
Throw in game days 🐛—realistic, controlled tests of your system's resilience—and you're not just fighting fires, you're building a fortress. Observability transforms from a tool to a strategy, empowering your systems to be as resilient as they are dynamic.
Maybe you've seen it due to our mention in our latest CloudWatch book issue, those contents are the main parts of David Yanacek's (Principal Engineer at Amazon CloudWatch) re:Invent talk.
As we're an absolute fan of this talk, which is a fantastic introduction to how to see observability and how to properly involve CloudWatch with all of its features, we want to give you a wrap-up about the talk in this issue.
So let's dive deep into the first chapter!
Diagnosing Issues 🐛
This chapter explains how CloudWatch helps us figure out problems with our systems. It highlights the need to pay close attention to data, watch what’s happening in different parts of the system, and set up alerts to monitor system health. We focus on using dimensions to understand our metrics better and how using composite alarms can make solving problems easier.
When fixing issues, we usually look at four main areas:
- Bad Dependencies: This is about watching for errors across the server or on specific websites. Using CloudWatch Composite Alarms helps us find and deal with these errors quickly.
- Bad Components: This section shows how to find and fix issues in parts of the system that work together. By looking at data and using maps that show how services interact, we can identify where the problems are.
- Bad Deployments: Here, we discuss how to quickly find out when new code causes issues and how to quickly (and even automatically roll back) fix this. We learn how to distinguish different health signs to fix problems quickly.
- Traffic Spikes: This part is about understanding why there’s a lot more traffic suddenly. We talk about the importance of detailed metrics and organized logs to handle these situations well.
We also cover:
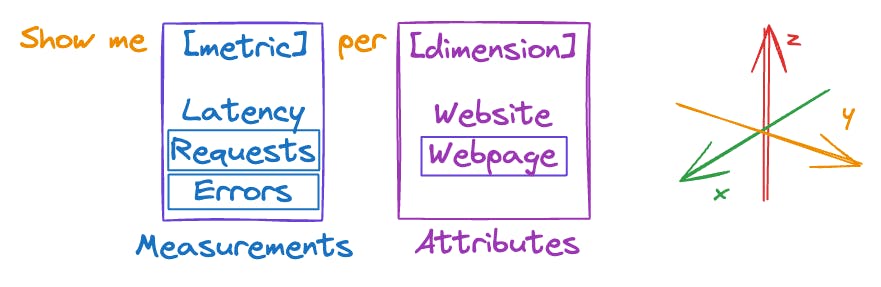
- Using dimensions to choose the right metrics: This means analyzing metrics in various ways to really understand what's happening.
- Finding patterns in detailed metrics: Here, we figure out how to interpret complex metrics to notice important trends.
- Navigating distributed systems with tracing: This involves summarizing and pinpointing problems in systems with many interconnected components.
Now we introduced a lot of theory. Let's dive into this by looking at a real-world application.
Let's picture a web application created by several teams, where each team handles a different section, like the navigation, shopping cart, search function, or product details. Now, imagine there's a problem with the shopping cart that we can't quite pinpoint, based on what customers are telling us.
Our objective is to understand precisely what the issue is, even though we're starting with little information about it. This part explains how CloudWatch is crucial for addressing such problems, ensuring our systems operate without a hitch.
Bad dependencies
This part of the chapter emphasizes the importance of monitoring error rates throughout the server and on specific webpages. It discusses the benefits of employing dimensions and CloudWatch Composite Alarms 🔔 for prompt problem identification and resolution.
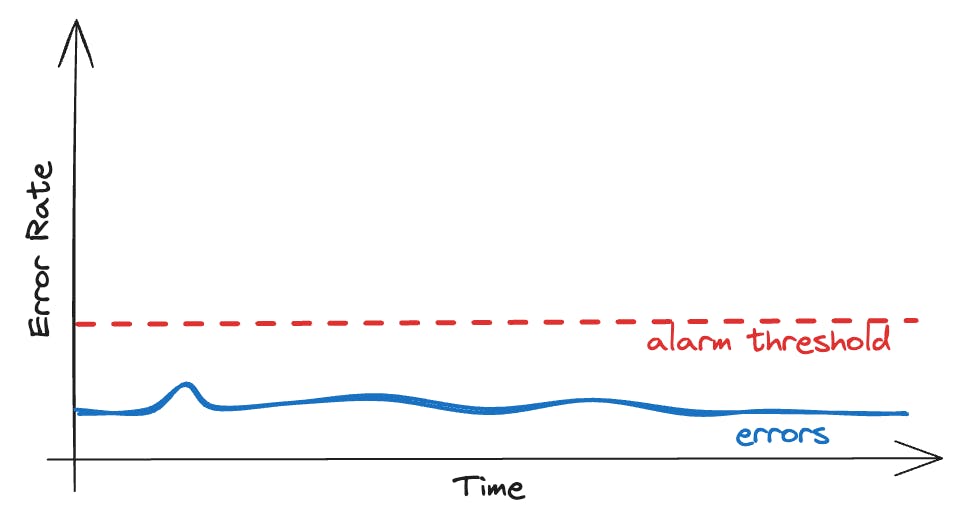
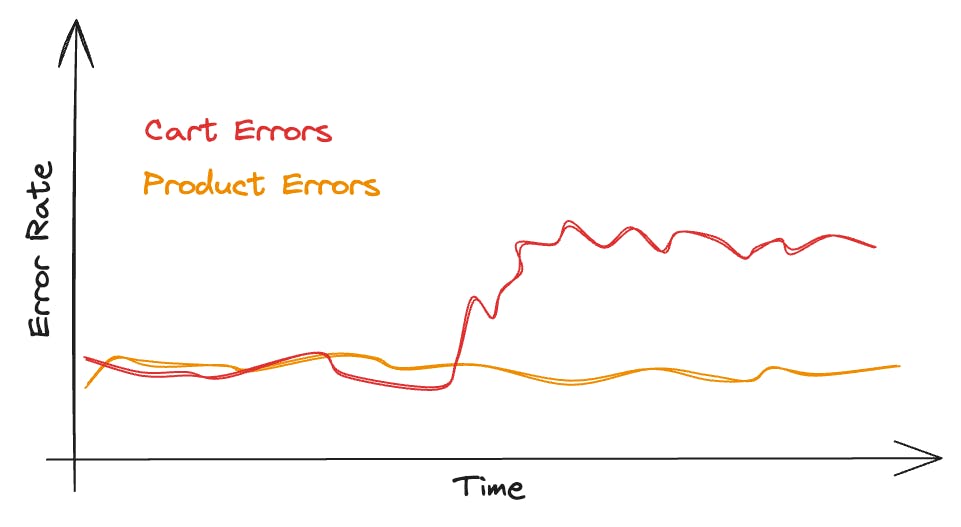
First step: Look at the server-wide error rate.
We don't see any red flags since there's no spike in errors. Everything looks like it's running smoothly as usual.
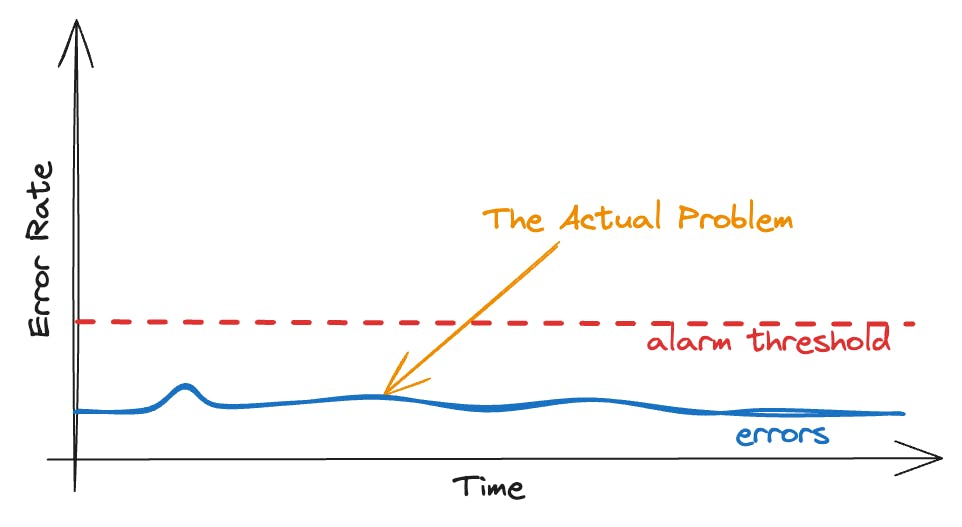
But we definitely know that there is a problem, we just can't see it in our first view.
The game-changer: Dimensionality.
Currently, our focus is on monitoring the site's overall error rate. It would be more effective to monitor the error rates of individual webpages.
When we break it down by page, the picture becomes clear:
The error rate for the shopping cart is significantly higher compared to other pages. Previously, this issue was overlooked due to the high traffic on the product page. The increase in errors on the shopping cart page was hidden by the large number of requests for the product page. 👻
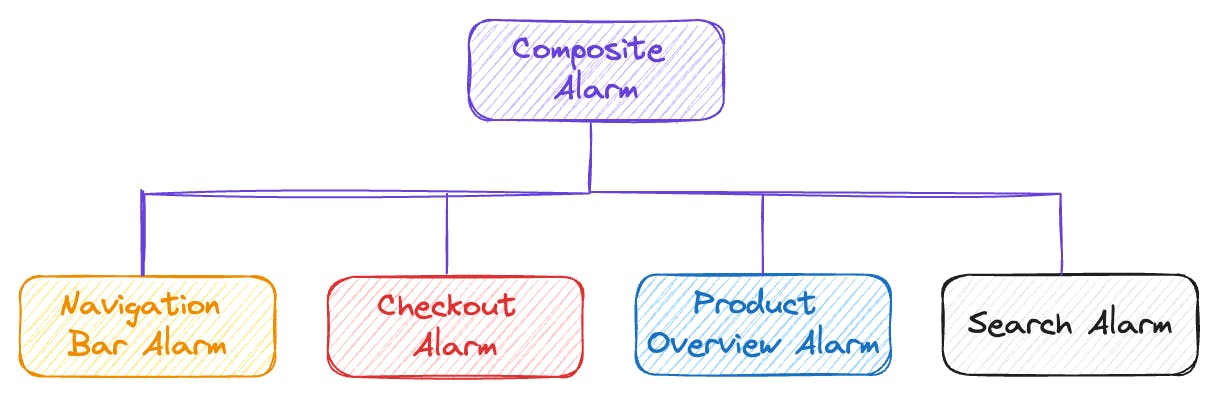
Setting up an alarm for each page lets us track errors more closely.
By monitoring errors this way, we can identify issues more rapidly.
However, if a widespread error affects every page, it could lead to numerous alarms going off simultaneously due to a problem that affects the entire site.
To manage this, we can consolidate our individual alarms into a single one.
Composite alarms allow us to set a collective threshold for all pages, triggering a single alert when surpassed. This strategy is vital for managing a large number of alarms without being overwhelmed by notifications, effectively minimizing alarm fatigue.
To effectively address bad dependencies, consider these strategies:
- Segment key health metrics of the application according to customer interactions, such as error tracking for each webpage or widget.
- Utilize CloudWatch Composite Alarms to consolidate alerts, thereby reducing the chances of alarm fatigue.
In the realm of distributed systems, understanding the flow of data and requests is critical. It’s essential to implement trace context to generate service maps, which help identify the origins of failures. This approach is crucial for diagnosing issues with problematic components within our system.
Although we’ve identified the shopping cart as a problematic area, determining whether the issue lies in the frontend, backend, or another area is complex due to the interconnected nature of our system.
Pinpointing the exact source of the problem remains a challenge.
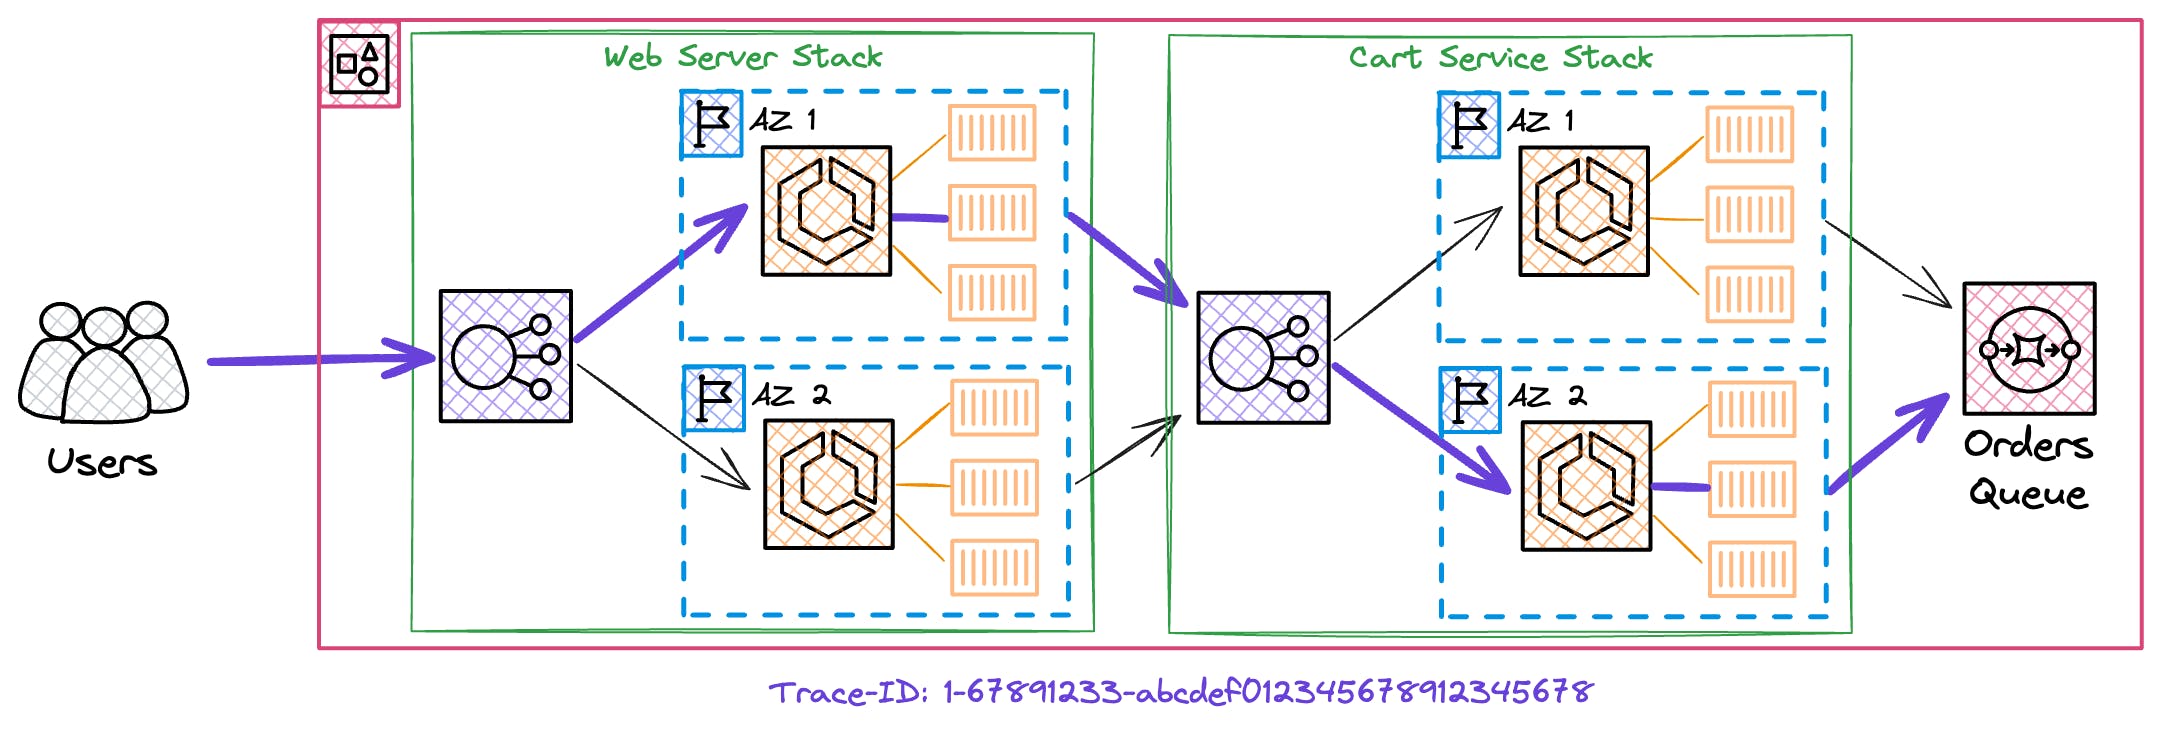
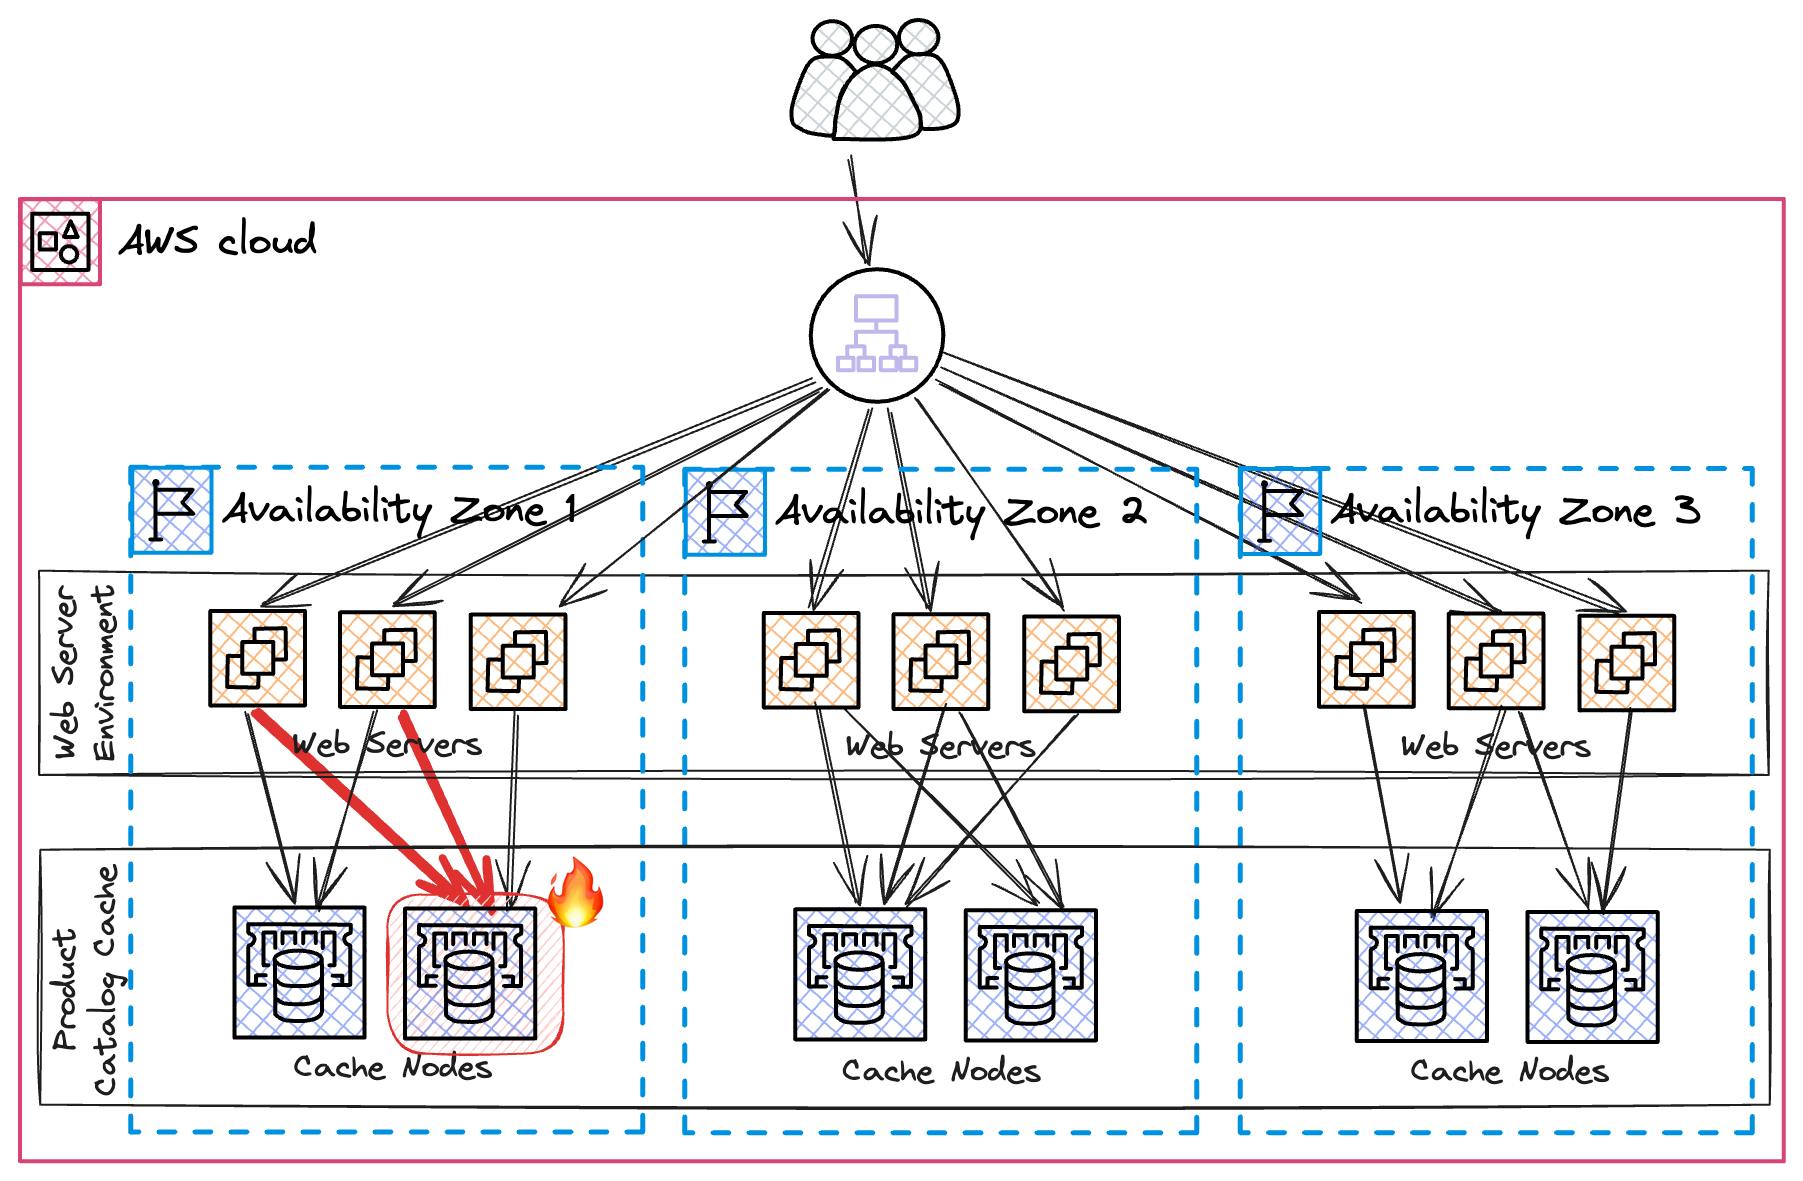
Here's the overview about our architecture that we use to run our application.
The process starts when the initial component generates a trace-id, which is then propagated throughout the system. This id enables us to follow the entire path of a request and identify where issues occur.
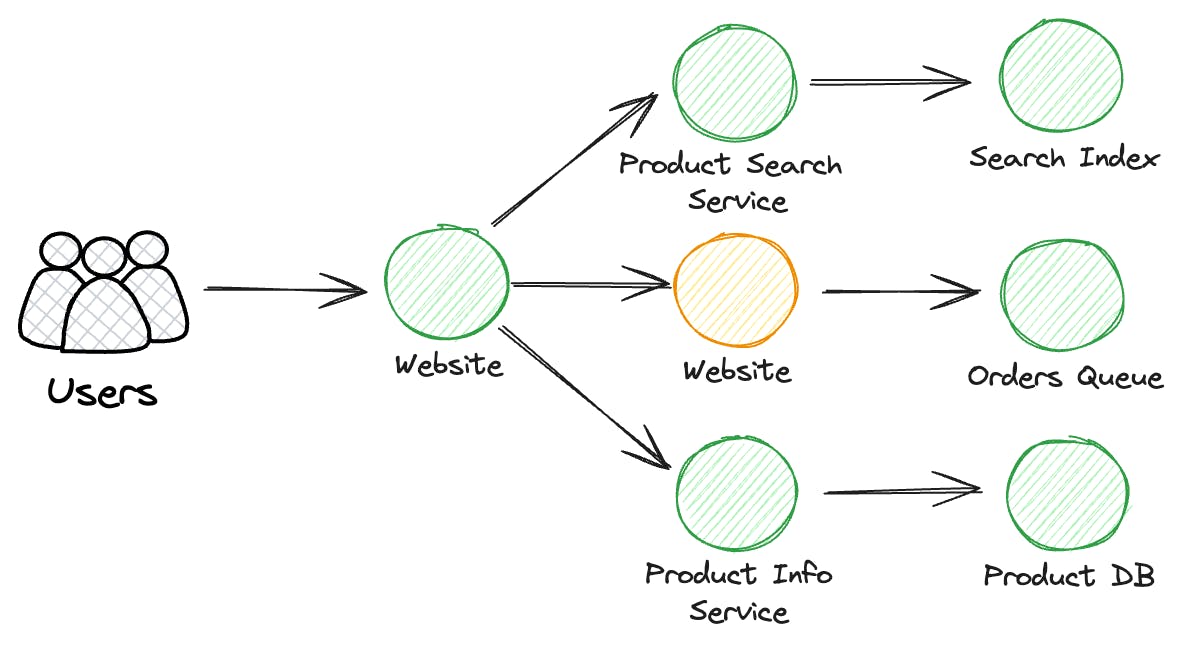
This information is collected by X-Ray 🕵️♀️, the distributed tracing system provided by AWS, which automatically creates a service map displaying the architecture of our website.
To identify a malfunctioning component, ensure you:
- Pass along the trace context with every call made to dependencies.
- Gather traces across your entire system, encompassing both AWS services and your applications, utilizing X-Ray.
- Have a look at the service maps created from these traces to pinpoint the specific area of your system that is underperforming during issues.
Let's look at a specific issue:
When a server exhausts its memory and crashes, it causes an increase in the error rate of our site. However, through health checks, we can identify the failing server. The load balancer then removes this server from the pool, leading to a reduction in error rates. This scenario illustrates how a load balancer's health check can effectively resolve certain issues.
However, the situation becomes more complex if a server is unable to connect to a downstream component due to a bug or network problem.
In such cases, health checks might still report the server as operational, even though it's not functioning properly.
This complexity arises because health checks typically do not cover the status of downstream components, which is a challenging area to monitor. Generally, it's not feasible (or even advisable) to include the health of downstream components in our own health checks.
Now, our site's error rates are up, but the source isn't clear. All health checks of our instances are green.
The fix? You've guessed it. More dimensionality!
Let's look at errors by instance.
Setting up individual alarms for each new instance isn't practical with autoscaling. Instead, we use CloudWatch Metrics Insights queries and alarms to monitor:
q1 = SELECTSUM(Failure)
     FROMSCHEMA(MyWebsite, InstanceId)
     GROUPBY InstanceId
     ORDERBYSUM() DESC
     LIMIT 10

    FIRST(q1)  > 0.01
        PERIOD = 1minute
        DATAPOINTS = 2
First, we will identify the ten instances experiencing the highest number of failures. Then, we will narrow down our focus to only those instances whose error rate exceeds 1%.
💡 Bonus: the query builder now supports the creation of queries using natural language, although this feature is not yet available in all regions.
However, addressing broader problems presents a different challenge. For example, if a cache node fails within a certain availability zone, it could trigger alerts for numerous servers in that area, complicating the process of identifying the underlying issue.
We add more detail to our metrics, like availability zones, to get clearer insights.
Now we can easily detect that the issue is within a single availability zone.
Key points for dealing with bad components:
- Break down health metrics by infrastructure boundaries, such as EC2 instances or availability zones.
- Use Metrics Insights queries to alarm on the parts of your infrastructure that are underperforming.
That's just the first two parts of the diagnosing issues section! There's a lot more to discover, as we've mentioned in the intro.
If you're interested in more, please have a look at David's talk. 🎥

We've also wrote a summary of the complete talk in our AWS fundamentals blog.
Previous Updates
Our goal is to let you participate in the creation of the CloudWatch Book as best as possible. For that, we want to send 1-2 emails per month. If you've missed the last ones, you can find them here:
- 10th December: Inside the CloudWatch Book 📕
- 11th January: Exploring Chapters & Learn About Evidently ⭐️
- 30th January: Deep Dive into CloudWatch with Our GitHub Tracker Tutorial 🕵️♀️
Thank you for your interest in the CloudWatch Book! If you only want to receive the AWS Newsletter and not these updates anymore, please update your preferences here.
Best ✌🏽
Sandro & Tobi
|
|
Tobi & Sandro
our goal is to simplify AWS & Cloud Learning for everybody. You don't need expensive certifications to build on AWS!
|